
Towards continuous resilience
How to anticipate, monitor, respond, and continuously learn from failure.

How to anticipate, monitor, respond, and continuously learn from failure.

I want to express my gratitude to my colleagues and friends Ricardo Sueiras, Isabel Huerga Ayza, Matt Fitzgerald, Antonio Valle, Aaron Schwam, and Won Huh for their valuable feedback.

Let me ask you couple questions:
Do you remember your first outage?
How smart and confident did you feel back then?
I clearly remember mine. I was very nervous and sweating a lot. I started making mistakes I usually wouldn’t. It was a disaster. I had no idea what I was doing.
It has always been a mystery to me why no one ever trained me to recover from outages. Not the school. Not my employers. No one.
Instead, and I think I can speak for many of us, we learn the hard way when failure happens in production.
Have you ever wondered why outages are so scary, by the way?
One apparent reason is, of course, the cost.
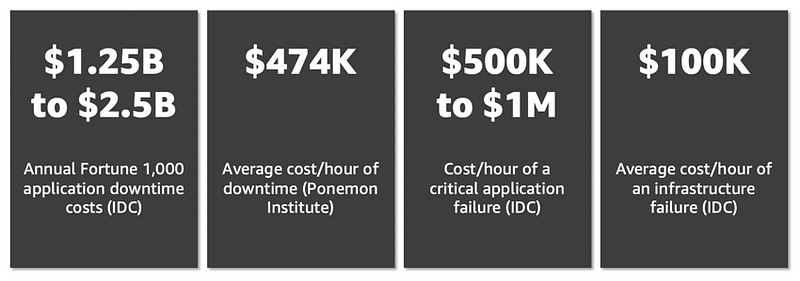
These are the latest estimations from IDC and the Ponemon Institute.
How many of you would like to lose $100K? Because that’s the average cost per hour of infrastructure downtime. $100K per hour!
Of course, these are averages, but it is scary. And that puts a lot of pressure on businesses.
Now think again about your previous outages. How long did they last?
Let’s see how easy it is to get to one hour.
Anatomy of an outage
If you look at the anatomy of an outage, it resembles something like that.
First is the detection — It is arguably the most important one. If you don’t detect fast, the chances are that your customers will be giving the alarm before you know you have an outage. Trust my words on that. You don’t want to learn from Twitter that your service is down. Remember that most monitoring solutions, alarms, and escalation tools can take several minutes to kick in.
Second is the evaluation — It is the “what is going on” moment, and that’s debugging, reading the logs, and trying to understand what we are dealing with. It is the most stressful moment since until you know what’s going on and how to fix it, uncertainty rules your world, and we, as human beings, are terrible at dealing with uncertainty. It is the phase where instinct is decisive and where experience is critical. Having a hunch into what’s going on and finding the issue fast makes a huge difference. Having a clear understanding of the blast-radius during the evaluation phase is crucial.
Third is the response — It is the moment when we deploy the fix or patch the impacted system. Automated tests in this phase are critical. You will do a fix in production, and the last thing you want is to make things worse. So before deploying a fix to production, make sure you run the fix through the entire testing pipeline. Avoid taking shortcuts or be ready to pay the price. Automate testing and validation to ensure consistency of review, to reduce errors caused by manual processes, and reduce the level of effort. Make sure to create new tests for what is going out!
Forth, it is the recovery. It is bringing the system back to normal operating levels. Incremental roll-outs and progressive recovery are the norms. Slow and steady wins the race.
Finally, it is confirmation — It is answering the question: is the service fully back to normal for my customers? Tracking customer experience will help you confirm that recovery, indeed, happened.
Unfortunately, you can probably realize that a one-hour outage is surprisingly easy to reach between all the phases.
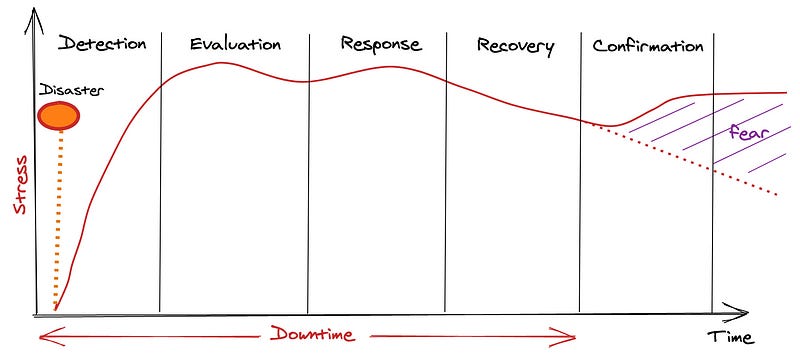
As you can see, I have also plotted the stress level during these different phases. It is not a scientific plot since I never directly measured my colleagues’ stress levels or mine. Still, it is how my customers, colleagues, and I have regularly experienced it in the past 20 years.
Notice the stress going up at the end?
Why are folks scared once the outage is over?
That’s because it is when fingers get pointed.
“This is your fault!” — someone probably.
You know, blame. So that’s when folks — on the front line — start to fear for their jobs.
What is the reaction of people and organizations that experience fear?
It is to avoid it, naturally.
The illusion of robustness
Many organizations lack confidence in their IT services and fear failures. They often believe that failures are preventable because they think IT services are predictable and that isolated incidents cause failures. These organizations often focus on maximizing the return on investment from their current IT services and resist changes.
This fear of failure has lead to the development of robustness-focused risk management frameworks — such as IT Infrastructure Library (ITIL) — designed to standardize IT management practices across industries put in place to reduce the risk of future failures.

Note: The latest evolution of ITIL — ITIL 4 — is the first significant upgrade to the ITIL framework since 2007, designed in large part to address the issues faced by robustness-focused software development and IT operations, containing guidance on how to apply Agile, DevOps, and Lean methodologies in the domain of service management.
The practices are what Jez Humble calls Risk Management Theater and are unfortunately often used to find the “guilty.”
Robustness-focused organizations believe complex systems are safe, except for the mistakes of unreliable people, an attitude Sidney Dekker calls the bad apple theory.
They believe that post-incident investigations must find the root cause of failure and that it is found in people’s wrong assessments, faulty decisions, and bad judgments.
When an organization focuses on robustness, it will often fail to invest time and money in non-functional requirements such as monitoring, telemetry, support, automation, learning, etc.
You would be surprised by the number of organizations I have talked to in the last five years that didn’t want to invest in support simply because they expected failures to be rare — and thus, it was a “low” risk they were willing to take.
Unfortunately, it is naive to think like that.
Werner Vogels, CTO of Amazon.com, said:
“Failures are a given, and everything will eventually fail over time.” — Werner Vogels, CTO, Amazon.com
Because production systems often comprise hundreds of dependencies, the probability is that something somewhere is most likely failing at any given time.
The truth is a production environment is a complex system that is unpredictable and in a perpetual state of failure.
Complex systems run in degraded mode.
Richard Cook explains:
“The complexity of these systems makes it impossible for them to run without multiple flaws being present.”
— Richard Cook, How Complex Systems Fail.
The alternative to this robustness-focused, top-down control approach is what Jez Humble calls adaptive risk management, an approach informed by human-centered management theories and based on systems thinking, transparency, experimentation, and fast feedback loops.
This adaptive culture encourages learning, sharing, and collaboration, essential for continuous improvement and key to resilience.
How do you trade the fear of failure for a growth opportunity and improvement?
The answer is, as you probably have guessed, to embrace failure and move towards continuous resilience.
Resilience
Resilience is the ability for a system to respond, absorb, adapt to, and eventually recover from unexpected conditions.
In Resilience Engineering In Practice, the authors break down resilience using a conceptual model known as the Four Cornerstones of Resilience.
(1) Anticipating — Understand what to expect, imagine potential failures, and attempt to mitigate those in advance.
(2) Monitoring — Observe operational conditions and alert when faulty conditions occur.
(3) Responding — Understand what to do when failure happens.
(4) Learning — Understand why the failure happened, derive best practices and recommendations, and share them with the rest of the organization.
Continuous resilience
Continuous resilience is a philosophy, a mindset that embraces complexity, values continuous improvement, and understands that failures are inevitable. It is a way to anticipate failure, effectively monitor and respond to issues, and encourage learning.
To be continuous also means doing it all the time, at every level of the organization, at every stage of the application development life cycle, and in every environment we operate.
The rest of this blog post will highlight what I believe are some of the most valuable principles — whether they are design patterns, practices, or tools — to anticipate, monitor, and respond to failure and support learning — in other words, to build continuously resilient applications.
1 — Anticipating
First, let’s look at developing our capability to anticipate — understand what to expect, imagine potential failures, and attempt to mitigate those in advance.
Code reviews and profiling
One of the essential parts of building resilient systems is reviewing and profiling your application’s code.
Code quality is critical, as quality impacts how safe, secure, and reliable your application is. It is the foundation on top of which many build businesses.
Continuously delivering high quality is critical for resilience.
Code is considered good if:
It follows a consistent style.
It is easy to understand.
It is well-documented.
It can be tested.
Code reviews have plenty of benefits: improving code quality, locating defects, mentoring newer engineers, lowering complexity, etc.
While human-based code review processes are mandatory, tools have become essentials to assist reviews and suggest improvements. Tools, unlike humans, don’t respond to stress or fatigue and are consistent with their judgments.
Amazon’s internal teams have used code reviewers and profilers on more than 30,000 production applications.
While working on improving its resilience for the biggest shopping day of the year, Prime Day, Amazon also realized a 325% efficiency increase in CPU utilization and lowered costs by 39% by using ML-powered code reviewers and code profilers.
That’s tens of millions of dollars in savings on compute and infrastructure costs — dollars that can be invested somewhere else.
That tool that Amazon.com used is publicly accessible to anyone using the AWS Console, and it is called Amazon CodeGuru.
Code reviews are essential at each stage of the application life cycle — both during development and once the application is up and running.

CodeGuru is powered by machine learning and provides recommendations for improving code quality and identifying expensive lines of code. It scans for critical issues, finds hard-to-find bugs, and also recommends how to remediate them before they become outages in production.
By integrating continuous code reviews and code profiling into your development pipeline, you will significantly improve code quality and, thus, continuously optimize your applications’ performance and cost.
Such practices promote transparency, learning, and sharing within an organization, which naturally improves its resilience.
Patterns for anticipating potential failures
While most people understand distributed systems are complex, it is common to think that this complexity only applies to applications with hundreds or thousands of micro-services.
That is, of course, not the case.
Even simple applications are complex — take, for example, a simple client-server communication. There are a lot of steps that involve completing a single round trip successfully!

It is impossible to consider all the permutations of failures that can happen in this simple distributed system, especially over multiple requests, so imagine for an entire application, running 24/7.
These failures can come from servers, networks, load balancers, disks, software, operating systems, or even system operators’ mistakes.
One of the most common triggers for outages is a cascading failure. One part of a system experiences a local failure and takes down the entire system through inter-connections and failure propagation. Often, that propagation follows the butterfly effect, where a seemingly small failure ripples out to produce a much larger one.
A typical example of a cascading failure is server overload. It occurs when traffic load distributed between two clusters brutally changes due to one of the clusters’ failure. The sudden peak of traffic overloads the remaining cluster of servers, which in turn, fails from resource exhaustion, taking the entire service down.
Anticipating these potential failures include designing systems capable of reducing the probability of failure. It is, of course, impossible to build systems that never fail — but few things can help reduce the likelihood of failure.
Reduce timeouts to drop orphaned requests
To illustrate the importance of timeouts, imagine that you have steady baseline traffic and that suddenly, your database decides to slow down, and your INSERT queries take a few seconds to complete. The baseline traffic doesn’t change, so this means that more request threads are holding on to database connections and the pool of connections quickly runs out. Other APIs start to fail because there are no connections left in the pool to access the database.
That is a classic example of cascading failure. If your API had timed-out instead of holding on to the database, it could have prevented the service from failing.
The importance of thinking, planning, and implementing timeouts is constantly underestimated. And today, many frameworks don’t expose timeouts in requests methods to developers — or even worse, have infinite default values.
Backoff on retry.
The default technique for dealing with errors is to implement retries on the requester side. This technique increases the reliability of the application and reduces operational costs for the developer.
However, at scale — and if requesters attempt to retry the failed operation as soon as an error occurs — the network can quickly become saturated with new and retried requests, each competing for network bandwidth. This pattern will continue until a complete system meltdown occurs.
It is, therefore, recommended to use backoff algorithms such as the common exponential backoff must be used. Exponential backoff algorithms gradually decrease the rate at which retries are performed, thus avoiding network congestion. However, backing off alone is not enough.
In the article “Exponential Backoff and Jitter,” Marc Brooker explained that the wait() function in the exponential backoff should always add jitter to prevent clusters of retry calls.
Note: I would recommend you also add jitter to all your periodic work — e.g., timers, cronjobs, etc. Defaulting to the hour is often the best way to have all the jobs start simultaneously — which in some cases can add a lot of extra load on a system.
Limit retries
Of course, you also need to limit the number of retries since the number of retries is also often set to infinite by default. Combined with the above-undefined timeouts, your application runs the risk of being stuck in an infinite retry loop.
I would even recommend setting your max retry to one. In most cases, one retry is enough to be resilient to intermittent errors. And more retries might do more damage to your systems than good.
Finally, it would be best to reduce the number of retries to zero in systems with chained dependencies except at the system’s entry and exit points.
To learn more about these patterns for anticipating potential failures — click here.
If you want to learn about how Amazon sets its timeouts and implements retries, I highly recommend this article from Marc Brooker, Senior Principal Engineer at AWS.
Simple designs and constant work
Now let’s talk about simple designs and constant work — because simplicity and simple mental models are essential to resilience.
To best illustrate the importance of simplicity and constant work, I will summarize what Colm MacCárthaigh, senior principal engineer at AWS, explains in the article “Reliability, constant work, and a good cup of coffee,” — which I highly recommend.
Under the hood, the Elastic Load Balancer (ELB) runs on the AWS Hyperplane, an internal service embedded in the EC2 network.
The ELB Hyperplane could handle configuration changes in two ways —with a push or a pull model.
A push model means that whenever a customer changes the configuration of their ELBs, that change is pushed out to all the Hyperplane nodes that need it.
The problem with the push approach is the system’s performance is typically correlated with the number of changes pushed into the system. Many changes mean the system will likely slow down. And when systems slow down, customers usually retry, putting even more stress into the system.

The pull approach, on the other hand, is surprisingly simple.
Rather than pushing changes to the ELB Hyperplane, customer changes are put into a configuration file and stored in Amazon S3. Then, rather than respond to a push, the ELB Hyperplane nodes constantly pull this configuration from S3 every few seconds.
The interesting bit here is that this pull happens even if nothing has changed. Effectively, the system is doing constant work: always pulling, processing, and loading the latest configuration regardless of whether there are changes.
The configuration file is also constant — it is the same size if one or hundreds of ELBs are configured. Configuration files have default dummy configurations that get overwritten by accurate customer data.
This pattern is called constant work and is one of the most critical ideas for building resilient systems.
Storing a file in S3 and fetching it over-and-over again in a loop, even from hundreds of machines, is also very simple to understand.
To me, that is the essence of simplicity.
Because we are dealing with complex systems doesn’t mean that we need to find complicated solutions. On the contrary, it means that we need to put extra effort into finding the simplest solution to the problem, even if it sounds, looks, and feels dull.
I know first hand that engineers love to engineer fancy solutions, I am guilty of that myself, but we should always thrive to Keep it Simple, Stupid.
Simple means easy to use, easy to repair, and reliable.
Take the Jeep for example — well-known for its simplicity and its ability to take a beating.
Keeping it simple also helps make sense of what is happening during an outage and, more importantly, facilitates new team members’ assimilation.
New employees often feel uneasy when introduced to complicated systems and shy away from saying it aloud or asking for help for fear of feeling stupid. And that can quickly become a problem, especially if and when the original authors of the complicated solution leave the company.
Simplicity is one of the most critical aspects of building resilience.
Limiting the impact of failure with cells
Another design critical in anticipation of failure is limiting its impact — something called blast-radius reduction. Cell-based architecture is one of the best ways to contain that blast-radius.

In a cell-based architecture, resources and requests are partitioned into cells, which are capped in size. Cells are multiple instantiations of the same service isolated from each other; these service structures are invisible to customers. Each customer gets assigned a cell or a set of cells; this is also called sharding customers.
This design minimizes the chance that a disruption in one cell would disrupt other cells. By reducing the blast radius of a given failure within a service based on cells, overall availability increases, and service continuity remain.
For a typical multi-availability zone service architecture, a cell comprises the overall regional architecture. Now take regional design — that’s our cell.
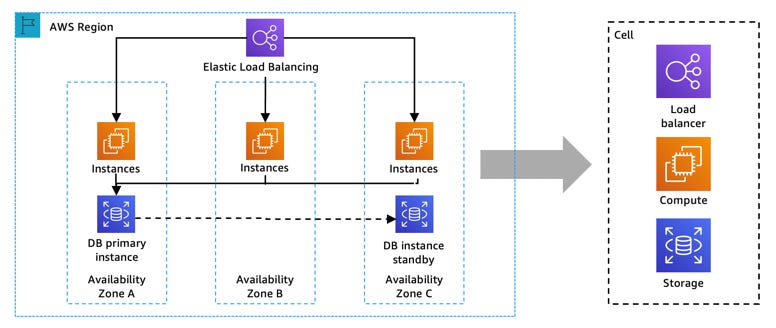
Then duplicate that cell and apply a thin routing layer on top of it. Each cell can then be addressed via the routing layer, using domain sharding, for example — something straightforward to do with Amazon Route 53. That is the essence of cell-based architecture.

Using cells has numerous advantages: workload isolation, failure containment, and the capability to scale out instead of up. But most importantly, because the size of a cell is known, once tested and understood, it becomes more straightforward to manage and operate. Limits are known and replicated across all the cells.
The challenge is knowing what cell size to start with since smaller cells are easier to test and operate, while larger cells are more cost-efficient and make the overall system simpler to understand. The rule of thumbs is to start with larger cells and once you grow, slowly reduce the size of your cells.
Immutable architecture
Let’s talk about one of the most common reasons for failure — mutability.

In a traditional IT infrastructure, servers are typically updated and modified in place — SSH-ing into servers and installing, updating, or upgrading packages, tweaking, and optimizing configuration files. During that time, the system is down. These types of updates often fail, which results in a manual rollback, with its risks.
All these were, and often still are standard practices. Less common practice, though, is to document all these changes.
The solution to mutability isn’t controls or change management, but not doing changes in the first place —by embracing immutable infrastructure principles.
Immutable infrastructure is a model in which no updates, security patches, or configuration changes happen “in-place” on production systems. If any change is needed, a new version of the architecture is built and deployed into production.
Since changes aren’t allowed in immutable infrastructure, you can be sure about the state of the deployed system.

That pattern is called the canary deployment. It is used to reduce the risk of failure when new versions of applications enter production by creating a new environment with the latest software version. You then gradually roll out the change to a small subset of users, slowly making it available to everybody if no deployment errors are detected.
Note: This pattern is compatible with the deployment of new cells in the cell-based architecture discussed previously.

There are few ways to deploy your application on AWS using the canary deployment pattern.
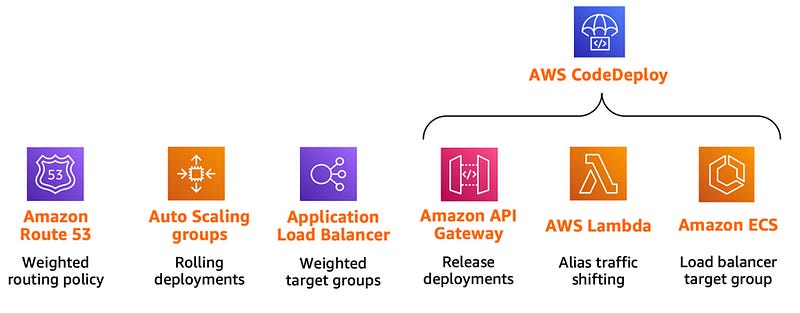
The three on the right natively support AWS CodeDeploy integration, making it easy to automate software deployments. It makes application deployments more resilient as they can easily be stopped and rolled back if there are errors.
Immutable infrastructures are more consistent, reliable, and predictable, and they simplify many aspects of software development and operations by preventing common issues related to mutability. You can learn more about immutable architecture here.
2 — Monitoring
Let’s look at developing our capability to monitor — observe operational conditions and alert when faulty conditions occur.
Steady State
One of the essential elements of monitoring is first to understand the system’s behavior in normal conditions. It is called the steady-state, and it varies when an unmitigated failure triggers an unexpected problem.
Why is understanding the steady-state so important?
After an outage, you want to make sure you return to a well-known steady-state and that the failures are no longer interfering with the system’s normal behavior.
The key here is not to focus on the system’s internal attributes (CPU, memory, etc.) but instead look for measurable output that ties together operational metrics and customer experience.
For that output to be in a steady-state, the system’s observed behavior should have a predictable pattern but vary significantly when failure in the system is introduced.
To give you some examples of steady-state, Amazon uses the number of orders per second as one of its steady-state metrics — and for a good reason. In 2007, Greg Linden, who previously worked at Amazon, stated that through A/B testing, he tried delaying a retail website page loading time in increments of 100ms and found that even slight delays would result in substantial and costly drops in revenue. With every 100ms increase in load time, the number of orders and sales dropped by one percent.
Netflix uses a server-side metric related to playback starts — the number of times a user clicks play on the remote control. They realized that the “SPS” (or starts-per-second) had a predictable pattern and fluctuated significantly when a failure occurred. The metric is rightly called the Pulse of Netflix.
Both examples are good steady states since they consolidate customer experience and operational metrics into single, measurable, and predictable output.
It goes without saying that if you can’t accurately measure your system, you can’t monitor drifts in the steady-state or even find one. Invest in measuring everything. Draw graphs of these measurements, even if they aren’t drifting. You’ll be surprised by correlations you never expected.
“Make it ridiculously simple for any engineer to get anything they can count or time into a graph with almost no effort.” Ian Malpass
Observability
As systems become more distributed, methods for building and operating them are rapidly evolving — and that makes visibility into your services and infrastructure more critical than ever.
Cindy Sridharan, the author of the book Distributed Systems Observability says that observability is a superset of monitoring,” and that “it provides not only high-level overviews of the system’s health but also highly granular insights into the implicit failure modes of the system”. Also, “an observable system furnishes ample context about its inner workings, unlocking the ability to uncover deeper, systemic issues.”
There are three commonly agreed-upon pillars of observability: metrics, logs, and trace.

Metrics: Numeric data measured at various time intervals (time series data); SLIs (request rate, error rate, duration, CPU%, etc.)
Logs: Timestamped records of discrete events that happened within an application or system, such as a failure, an error, or a state transformation
Traces: A trace represents a single user’s journey across multiple applications and systems (usually micro-services).

While all AWS services represented here are critical to observability — one is particularly helpful for resilience and recovering fast from outages — ServiceLens.
ServiceLens lets you easily correlate logs, metrics, and traces to identify service bottlenecks quickly.

This correlation of metrics, logs, and traces is key to resilience since you don’t have to go back and forth between different tools — and thus, your focus and attention stay on the issue at hand.
To learn more about observability on AWS, I highly recommend that workshop built by the AWS observability team.
Note: It is also worth mentioning that we recently launched in preview — AWS Distro for OpenTelemetry — a distribution of the OpenTelemetry project that lets you instrument your applications to send correlated metrics and traces to AWS or partner monitoring solutions.
Health Checks
Two types of failures can impact a server: local or host failures, which are on the server itself, and dependency failures, which are the failure of critical dependencies necessary to handle a request successfully.
Different things trigger host or local failures. For example:
Hardware malfunctions such as disk failure
OS crash after upgrade/updates
Security limits such as open file limits
Memory leaks
Unexpected application behavior
External factors cause dependency failures. For example:
Connectivity loss to the caching layer or the database
Service broker failures (queues)
Invalid credentials to object storage S3
Lack of synchronization with NTP servers
Connectivity issues with third-party providers (SMS, notifications, etc.)
Unexpected networking issues
The type of failures you are monitoring defines the kind of health check you are using: a shallow health check probe for a host or local failures; and a deep health check probe for dependency failures.
(1) Shallow health checks often manifest themselves as a simple ‘ping’, telling you superficial information about a server instance’s capability to be reachable. However, it doesn’t show you much about the system’s logical dependency or whether a particular API will successfully return from that server.
(2) Deep health checks, on the other hand, give you a much better understanding of your application’s health since they can catch issues with dependencies. The problem with deep health checks is that they are expensive — they can take a lot of time to run, incur costs on your dependencies, and are sensitive to false-positives.
Health checks monitor both local and dependency information to determine if a server can successfully handle a service request. For example, a server might run out of database connections. When this happens, the load balancer should not route requests to that server but instead distribute the service traffic to other available server instances.
Health checks are necessary because if you have a fleet of 10 server instances behind a load balancer, and one of them becomes unhealthy but still receives traffic, your service availability will drop to, at best, 90%.
Continuing the above example, if a new request hits the server instance, it will often fail fast since it can’t get a new database connection opened. And without explicit handling of that error, it can easily fool the load balancer into thinking that the server instance is ready to handle more requests. That is what we call a black hole.
Unfortunately, it gets more complicated.
Imagine a second that you have learned your lesson and implemented a deep health check on each server, testing for connectivity to the database. What happens if you have an intermittent network connectivity issue? Do you take the entire fleet of server instances out of service or wait until the problems go away?
That is the challenge with health checks — striking a balance between failure detection and reaction.
Understanding how to strike that balance and properly use health checks is key to building resilient applications and is unfortunately very time-consuming but necessary to get right.
To help you get started, please check my detailed recommendation list for implementing health checks.
3 — Responding
Now, let’s take a look at how to respond when failure happens.
John Allspaw said:
“Being able to recover quickly from failure is more important than having failure less often.” — John Allspaw, Founder and Principal at Adaptive Capacity Lab.
And this could not be more accurate!
Defining service criticality
Recovering is not a binary solution — remember what we talked about earlier: Production systems often comprise hundreds of dependencies or services — Some more critical than others.
Imagine your company’s business provides email service to your customers; the critical functions are to receive and send emails. The rest is good-to-have, normal operations: e.g., filters, calendar integration, address book, etc.
Every service has some criticality levels — and during an outage, understanding these levels helps you prioritize what you should do.
Map your dependencies
Take a moment to think about your application. Do you have a clear map of its dependencies? Do you know what impact they will have in the event of a failure?
If you’re not familiar with your application code or if it grows too large, it can be challenging to know precisely what the code does and what its dependencies are. Understanding those dependencies and how they could be impacting your application and users is critical to understanding how to respond during an outage.
Identifying and documenting these dependencies is called dependency mapping and is typically conducted for large application code-bases using tools such as code profiling and instrumentation. You can also map your dependency by monitoring network traffic.
Similar to services, not all dependencies are the same. Some are critical, and some are non-critical.
Critical dependencies imply that your service cannot operate without them. Non-critical dependencies “should” have no impact on your service if they were to fail. Getting a handle on dependencies requires a clear understanding of the APIs used by your application, and it can be a lot harder than it seems, at least for larger applications.
Start by enumerating your APIs. Identify the most expensive and critical ones. Pull the dependencies from the code repository, look at connection logs, and then pull the documentation (if it exists, hopefully, it does, or you have a more significant issue at hand). Use profiling or tracing tools and filter out external calls.
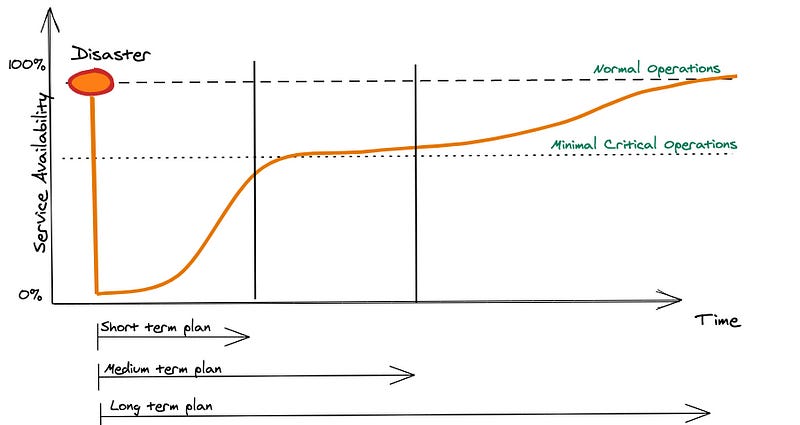
You can derive your different operational modes from a recovery perspective once you understand your dependencies and service criticality. At a minimum, you need to define what your “normal operations” mode and ”minimal critical operations” mode are. You can, of course, have more levels of criticality — but this is the bare minimum.
You can then work out the different recovery plans for each mode, from short to long-term plans.
While this seems obvious in hindsight, it is often not done — and during an outage, instead of having a focused recovery operation, you end up with unorganized and inefficient teams resulting in prolonged outages.
Event-driven architecture
As we talked about earlier, automation is a critical part of resilience. But automation is not only for deployments. It is also a crucial pattern for responding to changes. Leveraging this pattern lets your architecture react in response to events. An event is a state change, or an update, or worse, a configuration change — remember our immutable pattern?

For example, here is a simple pattern that responds to a change in an S3 bucket configuration. If a change event is triggered, it reverts that change and re-apply a strict configuration — in this example, setting a bucket private after it was made public.
As you can see, the event-driven patterns are an extension of the immutability pattern and are something that you should put in your toolbox.

Mutability is one of the most critical attack vectors for cybercrimes.
When a bad actor attacks a host, most of the time, it will try to modify servers in some way — for example, changing configuration files, opening network ports, replacing binaries, modifying libraries, or injecting new code.
A change means the architecture is compromised, and it should be isolated and replaced immediately.

That is DevSecOps at its best! Detect. Isolate. Replace.
Understanding that simple pattern will give you a tremendous amount of opportunities to improve your application’s resilience to failure.
4 — Learning
Finally, let’s take a look at learning — understand why the failure happened, derive best practices and recommendations, and share them with the rest of the organization.
Correction-of-Errors (COE)
One critical mechanism to continuously improving resilience is something Amazon calls Correction-of-Errors (COE) — it is similar to a postmortem. It’s a process where a team reflects on a problem, maybe an unexpected loss of redundancy, or perhaps a failed software deployment, and documents what the problem was and how to avoid it in the future.
There are six main sections in a COE document.
1 — What happened?
2 — What data do you have to support your analysis?
3 — What was the impact on the customers?
4 — What are the contributing factors?
5 — What did you learn?
6 — How will you prevent it from happening again in the future?
We use this mechanism to learn from our mistakes, whether they’re flaws in tools, processes, or organizations.
The COE mechanism is critical to identifying contributing factors to failures and, more importantly, drive continuous improvement.
The key to being successful during a COE is to be open and transparent about what went wrong. It’s key to the COE process and resilience in general, and it can be quite hard in an environment that doesn’t embrace and encourage such behavior.
Remember that people generally have good intentions, and thus, you should never stop your investigation at human errors.
Reject the Bad Apple Theory.
Instead, listen carefully, be vocally self-critical, dive deep on the issues at hand and focus on learning and deriving lessons and best practices for the other parts of the organization to apply.
To learn more about our COE process, please check the wonderful re:Invent 2019 talk from Becky Weiss, a senior principal engineer at AWS.
Chaos engineering
And finally, continuous resilience would not be possible without talking about chaos engineering.
Chaos engineering is the process of:
1 — Stressing an application in testing or production environments
2 — Observing how the system responds
3 — Implementing improvements.
And we do that to prove or disprove our assumptions about our system’s capability to handle these disruptive events.
Chaos engineering helps improve your application’s resilience and performance by uncovering hidden issues and exposing monitoring, observability, and alarm blind spots.
More importantly, chaos engineering practice gives organizations a platform to perfect operational skills critical to building a culture of resilience and improving recovery time from failures.
To learn more about chaos engineering, please check my collection of blog posts and open-source projects.
To help you get started with chaos engineering, we have recently launched AWS Fault Injection Simulator— which is now generally available in all AWS commercial regions.
Wrapping up!
That’s all for now, folks. Thank you for reading this far! Please let me know if you believe I forgot something critical — I probably did. One important thing to remember is that change takes time. Don’t lose patience and trust in the process. There is no secret sauce.
“Excellence, then, is not an act, but a habit”. -Will Durant — Writer, historian, philosopher, and teacher.
The real secret of achieving resilience is based on habits, paying attention to details, being paranoid about what could go wrong. And consistently thrive for improvements.
Adrian
—
Subscribe to my stories here.
Join Medium for $5 — Access all of Medium + support me & others!