
Monitoring Chaos Engineering Experiments with Datadog
Tutorial — Using Datadog Alarms with Amazon EventBridge to Safely Monitor AWS Fault Injection Simulator Experiments

Tutorial — Using Datadog Alarms with Amazon EventBridge to Safely Monitor AWS Fault Injection Simulator Experiments

Many businesses and organizations adopt cloud computing as a key aspect of their technology strategy. While most applications can be migrated easily, some need modernization before they can be moved to the cloud. There are also applications that must remain on-premises due to extreme low-latency requirements, and data sovereignty or residency requirements. This leads many organizations to adopt hybrid- or multi-cloud architectures. These multi- and hybrid-cloud setups make it harder for organizations to have visibility across the complete landscape.
As workloads move to these hybrid- and multi-cloud setups, performance monitoring can become difficult, preventing engineers from having the necessary data and visibility needed to perform their jobs. Often, they have data from individual cloud providers but dont have a consistent view across their services. This makes it challenging to understand their system’s characteristics and what might be causing issues.
In addition, this added infrastructure complexity pushes many of these organizations to adopt chaos engineering in order to identify weaknesses in their complex infrastructure, applications, and business processes.
Thus, these setups typically require a uniform monitoring solution to ensure all the components work together across cloud environments, operating systems, storage, servers, virtualized systems, etc.
Such monitoring solutions used in these hybrid or multi-cloud setups are:
In this tutorial, I describe how to integrate such 3rd party monitoring services — in particular Datadog — with AWS Fault Injection Simulator for customers to safely adopt chaos engineering practices in their organizations.
What is AWS Fault Injection Simulator?
AWS Fault Injection Simulator (FIS) is a fully managed service for running fault injection experiments to improve an application’s performance, observability, and resiliency. FIS simplifies the process of setting up and running controlled fault injection experiments across a range of AWS services, so teams can build confidence in their application behavior.
FIS can be used via the AWS Console or the AWS CLI. The console is great for getting started and trying things out during a GameDay, for example, while the AWS CLI lets you automate things with your CI/CD pipeline.

Once you start a fault injection experiment, FIS injects failures, real failures, on your AWS resources.
To make sure experiments are run safely on AWS workloads, FIS provides guardrails, such as Stop Conditions that will automatically stop the experiment if their status change.
Stop conditions support CloudWatch alarms but it is also possible to support the 3rd party monitoring solutions mentioned above by using AWS EventBridge.
EventBridge is a event-bus service that uses events to connect application components together, making it easier for developers to build event-driven applications. It it used to connect data streams between applications, SaaS applications, and AWS services. It also provides a simple way to filter or transform events in order to build precise event-driven workflows.
The integration described in this tutorial is detailed in the diagram below and uses AWS EventBridge to forward Datadog events to CloudWatch log, from which we create a metric and an alarm that can be used directly in AWS FIS.

The integration provides a stop condition with a reaction time of approximately 60 seconds since metrics produced by AWS services are standard resolution by default, with data having a one-minute granularity.
In the following sections, I will walk you through building this integration step-by-step.
Buckle up!
1# — Creating an EventBridge Bus
Navigate to the Datadog — Amazon EventBridge integration tile to see a list of AWS accounts integrated in Datadog where you can create Event Bridges.

Within the AWS account of choice, create a new event bus by providing a name and selecting the region where you want it to exist.

This will create an EventBridge with the following pattern aws.partner/datadog.com/<name>

Once the EventBridge bus is created, we can use the @awseventbridge-<EVENT_BUS_NAME> syntax to send alert notifications to event buses.
For this tutorial, the EventBridge name is @awseventbridge-DataDogEB
2# — Creating a Datadog Monitor (Alarm)
Let’s create a High CPU Load Monitor. If you already have one, skip directly to the Notify your team section below.
Navigate to Monitors and click New Monitor

Create a simple Metric-based Monitor.

Create a Threshold Alert out of the system.cpu.user metric.
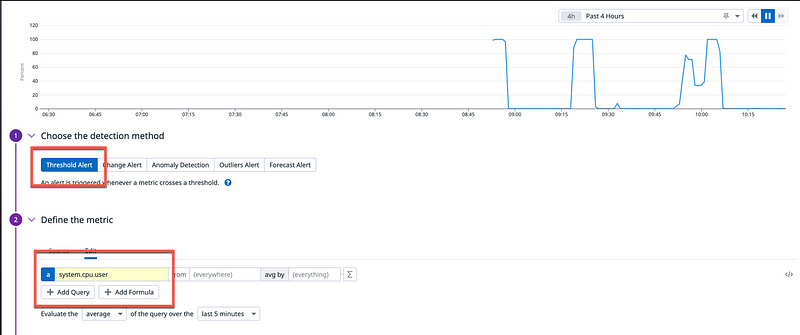
Define the Alert Threshold at 70% and the Warning Threshold at 50%.

In Notify your team, define who to notify in case the alarm gets triggered. Use the @awseventbridge-DataDogEB syntax to send alert notifications to event buses.

When Datadog sends an Alarm notification, the event is a JSON object similar to the one presented below:
{
"version": "0",
"id": "a8512e44-5bd9-7779-feec-9fc7cc487bc5",
"detail-type": " "detail-type": "Datadog Alert Notification",",
"source": "aws.partner/datadog.com/TestFISIntegration",
"account": "696105942657",
"time": "2023-03-01T12:55:49Z",
"region": "us-east-1",
"resources": [],
"detail": {
"date_detected": 1677675349000,
"alert_type": "error",
"last_updated": 1677675349000,
"event_type": "query_alert_monitor",
"date_ended": null,
"tags": [
"availability-zone:us-east-1a",
"aws_account:696105942657",
"host:i-02e6e0091d0a42e10",
"iam_profile:ssm-chaos",
"image:ami-038f1ca1bd58a5790",
"instance-type:t2.micro",
"kernel:none",
"monitor",
"region:us-east-1",
"security-group:sg-05bdb7c53fa685685",
"ssmtag:chaos-ready"
],
"msg_title": "[Triggered] [TEST] Alert CPU",
"priority": "normal",
"date": 1677675349000,
"meta": {
"text_only_message": "@adhorn@amazon.com @awseventbridge-TestFISIntegration\n\nTest notification triggered by adhorn@amazon.com.\n\nsystem.cpu.user over host:i-02e6e0091d0a42e10 was >= 50.0 on average during the last 5m.\n\nMetric value: 0.0",
"monitor": {
"name": "[TEST] Alert CPU",
"tags": [
"host:i-02e6e0091d0a42e10"
],
"deleted": null,
"created_at": 1677675349000,
"org_id": 1000102558,
"modified": 1677675349000,
"options": {
"notify_audit": false,
"silenced": {},
"include_tags": false,
"thresholds": {
"critical": 50,
"warning": 20
},
"require_full_window": false,
"new_host_delay": 300,
"notify_no_data": true,
"renotify_interval": 0,
"no_data_timeframe": 10
},
"templated_name": "[TEST] Alert CPU",
"query": "avg(last_5m):avg:system.cpu.user{host:i-02e6e0091d0a42e10} >= 50",
"message": "@adhorn@amazon.com @awseventbridge-TestFISIntegration\n\nTest notification triggered by adhorn@amazon.com.",
"type": "query alert",
"id": 10143941
},
"sub_group_count": null,
"transition": {
"trans_name": "Triggered",
"trans_type": "alert"
},
"states": {
"dest_state": "Alert",
"source_state": "OK"
},
"avalanche_window": null,
"message_parts": {
"last_triggered_ts": "2023-03-01T12:55:49Z",
"message_suffix": "",
"links": [
{
"url": "/monitors/10143941?from_ts=1677674449000&to_ts=1677675649000",
"text": "Monitor Status",
"key": "status"
},
{
"url": "/monitors/10143941/edit",
"text": "Edit Monitor",
"key": "edit"
},
{
"url": "/infrastructure?filter=i-02e6e0091d0a42e10",
"text": "View i-02e6e0091d0a42e10",
"key": "host"
},
{
"url": "/process?from_ts=1677674449000&to_ts=1677675769000&live=false&showSummaryGraphs=true&sort=cpu%2CDESC&query=host%3Ai-02e6e0091d0a42e10",
"text": "Show Processes",
"key": "processes"
}
],
"query_summary": "%%%\n**system.cpu.user** over **host:i-02e6e0091d0a42e10** was **>= 50.0** on average during the **last 5m**.\n%%%",
"message_prefix": "",
"message": "%%%\n@adhorn@example.com @awseventbridge-TestFISIntegration\n\nTest notification triggered by adhorn@amazon.com.\n%%%"
},
"result": {
"group": "",
"display_logs_sample": {},
"result_ts": 1677675349,
"logs_url": "",
"state_counts": {
"0": 0,
"1": 1,
"2": 0,
"3": 0,
"5": 0,
"6": 0
},
"avalanche": false,
"groups": {
"": {
"status": 1
}
},
"evaluation_ts": 0,
"group_key": "",
"state_id": 1,
"result_id": 0,
"num_groups": 1,
"metadata": {
"to_js_ts": 1677675349000,
"monitor_id": 10143941,
"metric": "system.cpu.user",
"snap_url": "https://p.datadoghq.eu/snapshot/view/dd-snapshots-eu1-prod/org_1000102558/2023-03-01/8af223ccc644816c295cee07cdabe44cd8e24958.png",
"from_js_ts": 1677674149000,
"alert_url": "/monitors/10143941?from_ts=1677674449000&to_ts=1677675649000",
"process_url": "/process?from_ts=1677674449000&to_ts=1677675769000&live=false&showSummaryGraphs=true&sort=cpu%2CDESC&query=host%3Ai-02e6e0091d0a42e10",
"space_aggr": null,
"is_usertest": true
}
},
"alert_cycle_key": 0,
"sub_groups_sample": null
},
"msg_text": "%%%\n@example@amazon.com @awseventbridge-TestFISIntegration\n\nTest notification triggered by adhorn@amazon.com.\n\n[](https://app.datadoghq.eu/monitors/10143941?from_ts=1677674449000&to_ts=1677675649000)\n\n**system.cpu.user** over **host:i-02e6e0091d0a42e10** was **>= 50.0** on average during the **last 5m**.\n\nThe monitor was last triggered at Wed Mar 01 2023 12:55:49 UTC.\n\n- - -\n\n[[Monitor Status](https://app.datadoghq.eu/monitors/10143941?from_ts=1677674449000&to_ts=1677675649000)] · [[Edit Monitor](https://app.datadoghq.eu/monitors/10143941/edit)] · [[View i-02e6e0091d0a42e10](https://app.datadoghq.eu/infrastructure?filter=i-02e6e0091d0a42e10)] · [[Show Processes](https://app.datadoghq.eu/process?from_ts=1677674449000&to_ts=1677675769000&live=false&showSummaryGraphs=true&sort=cpu%2CDESC&query=host%3Ai-02e6e0091d0a42e10)]\n%%%",
"aggregate_event_id": null,
"source_type_name": "Monitor Alert",
"id": "6935910529845654407"
}
}Notice the “alert_type”: “error” in the detail section of the JSON object. We will use that little detail to build the EventBridge rule.
3# — Creating an EventBridge Rule
Navigate to the EventBridge Console and create an EventBridge rule to handle Datadog Alarm events.
That rule will be used to filter Alarm Error events and forward them to a Amazon CloudWatch Log Group. Forwarding events to a Log Group is interesting for debugging purposes since it let us visualize each events and verify the integration is working as expected.
Note: You don’t have to forward events to a CloudWatch Log Group. Instead, you can use EventBridge TriggeredRules metric directly to setup the CloudWatch Alarm. For more details, check the end of the tutorial (Alternative 3#)
Navigate to EventBridge rules, select the event bus created earlier, in my case aws.partner/datadog.com/DataDogEB, and click Create rule.

Name the rule Datadog-AlarmErrorEvents-Rule, give it short description, e.g., “Rules for Datadog Alarm Error Only events”. Make sure to select the event bus aws.partner/datadog.com/DataDogEB.
The rule type should be “Rule with an event pattern.”

Click Next.
In order for the rule to trigger only on Alarm Error notifications, we need to define a specific Event Pattern to match event of “alert_type”: “error” which is used by Datadog to when an Alarm triggers.
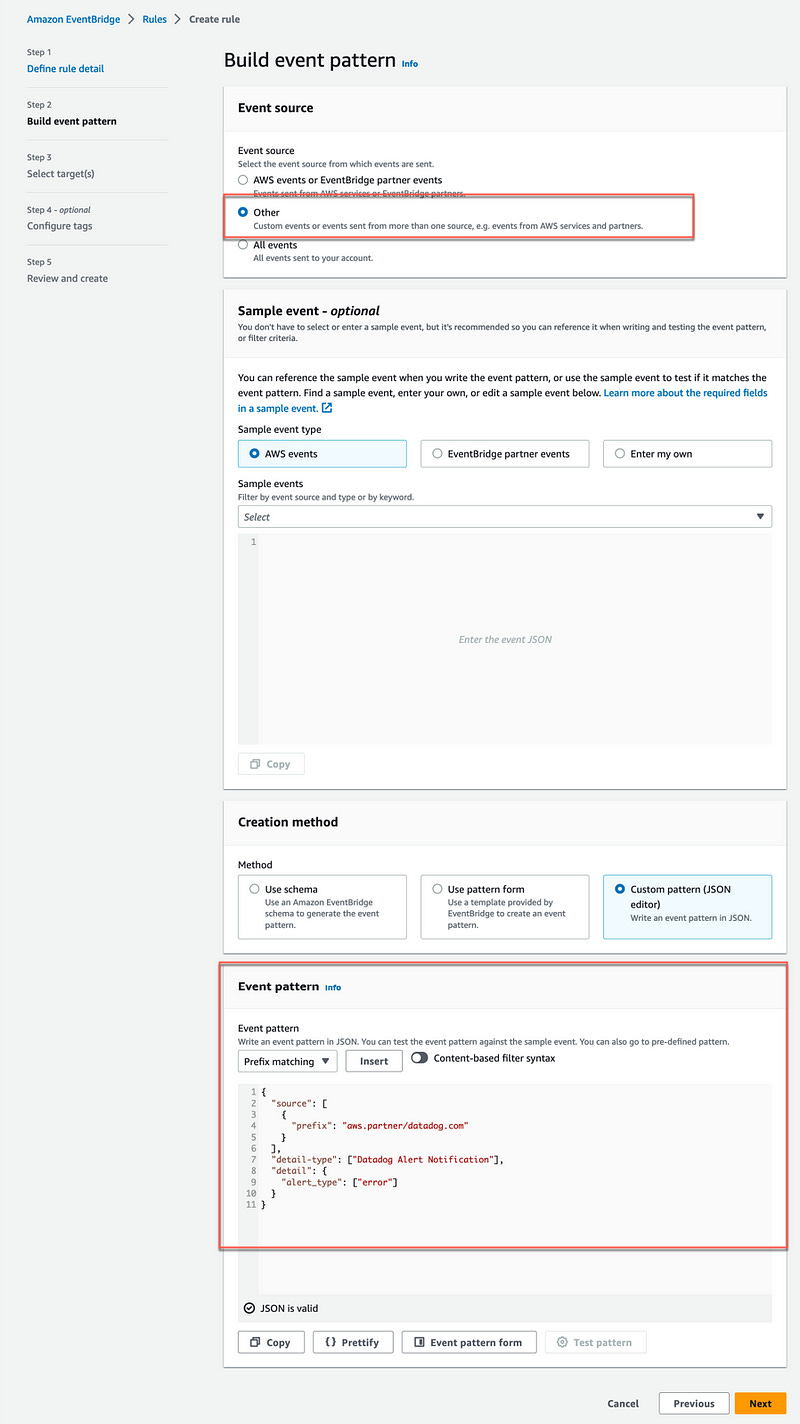
Following is the JSON object for the event pattern:
{
  "source": [
    {
      "prefix": "aws.partner/datadog.com"
    }
  ],
  "detail-type": ["Datadog Alert Notification"],
  "detail": {
    "alert_type": ["error"]
  }
}
For the target, select AWS CloudWatch Log Group, and for the Log Group name, /aws/events/datadog-alarm-error-events.

Click Next.
Review and click create. The newly created rule should appear in the list of EventBridge Rules.

4# — Verifying the integration
Let’s verify the Datadog Alarm notification events gets properly forwarded to the CloudWatch Log Group.
In the rule Targets tab, click the handy link to the CloudWatch Log Group datadog-alarm-error-events.

Since it is new, their is no events yet.

Go back to the Datadog console, navigate to the Monitors, and select the monitor we created earlier. Click edit.
From the edit page, you can send a helpful Test Notifications.

Navigate back to CloudWatch Log Group. You should fairly quickly see a new Log Stream appear with the Datadog test event.

If you click on that Log Stream, you can inspect the JSON object sent by Datadog.

5# — Creating a CloudWatch Alarm
CloudWatch Log Groups create two type of metrics — IncomingLogEvent and IncomingBytes automatically. You can find these metric in CloudWatch Metrics if you search for datadog-alarm-error-events.

We will use the IncomingLogEvent metric to create the CloudWatch Alarm.
Navigate to Cloudwatch Alarm and click Create alarm.

Select Metric alarm.

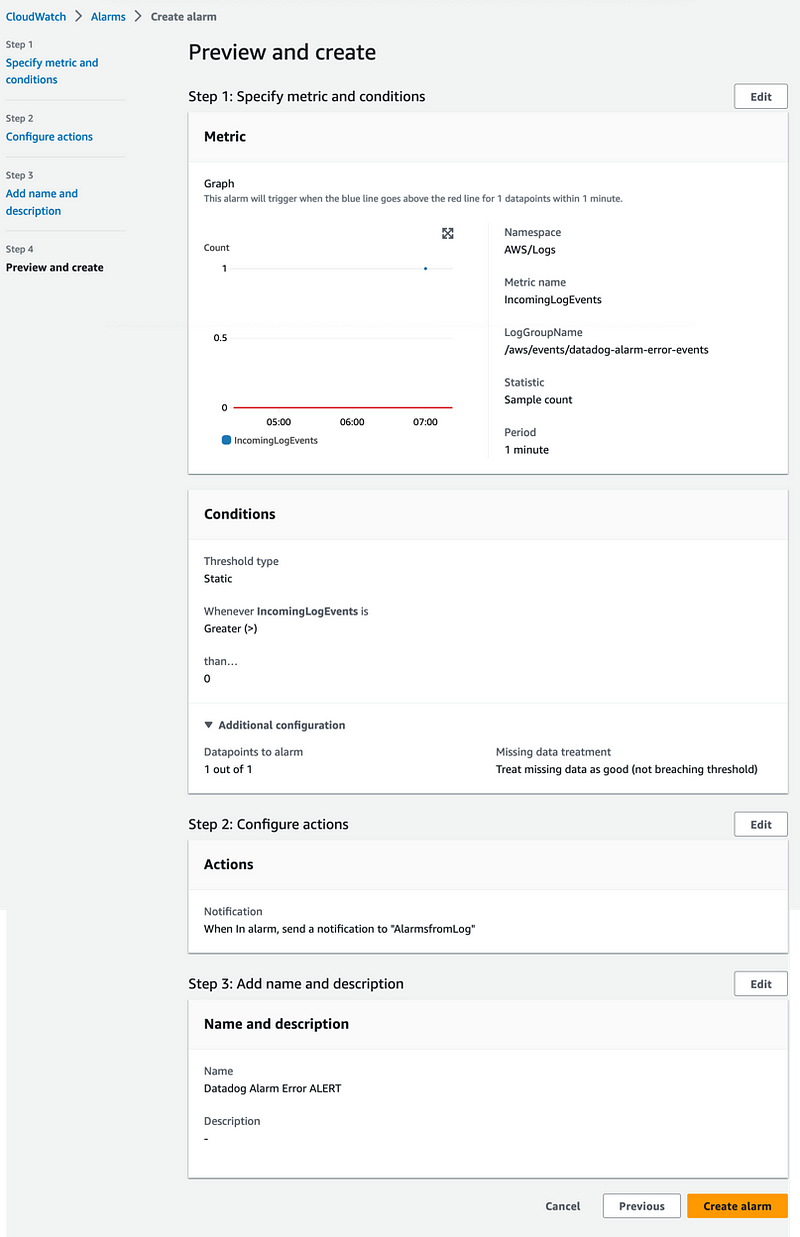
Select Logs as the AWS Namespace, Log Group Metrics as the metric, and select the metric called IncomingLogEvent from the LogGroupName /aws/events/datadog-alarm-error-events
Create a Statistic Alarm using Sample Count over a period of 1 Minute and set the threashold to greater than 0.
Make sure to select Treat missing data as good since we want the Alarm to be in OK state when there are not events coming from Datadog.

Click Next. For Notification, select or create a new topic.

Click Next.
Give the alarm a name, e.g., Datadog Alarm Error.
Click Create Alarm. The alarm is now created and listed in CloudWatch Alarms.

Verify the alarm is working as expected by navigating back to Datadog Monitors and sending another Test notification. The Alarm should switch to In Alarm state within 60 seconds.

6# —Using the CloudWatch Alarm as stop condition for AWS Fault Injection Simulator
We can now use that CloudWatch alarm in any AWS FIS experiment as a Stop-Condition.

Once you have added the CloudWatch Alarm in the FIS experiment template, start the FIS experiment, and navigate back to Datadog and send another Test notification.
The FIS experiment should be stopping within 60 seconds with the message Experiment halted by stop condition.
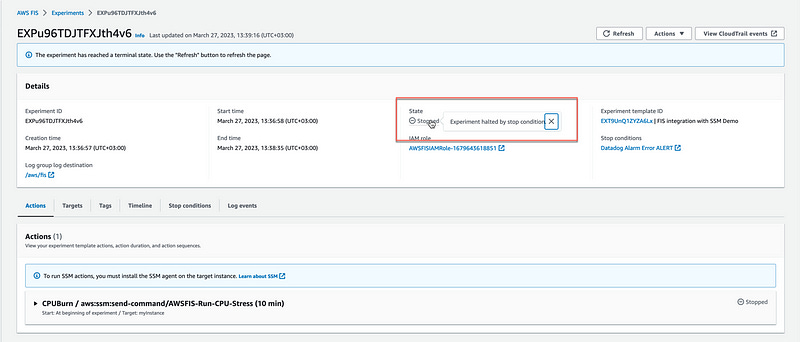
Done! We now have Datadog Alarms integrated directly with AWS FIS experiments.
Alternative 3# — Leveraging TriggeredRules Metrics from EventBridge
As mentioned earlier, you don’t really have to forward Datadog events to CloudWatch Log Group. Instead, you can use TriggeredRules metrics automatically generated by EventBridge to create the CloudWatch alarm.

TriggeredRules metrics illustrate the number of times a rule matched an event or was executed. This metric is useful in confirming whether a scheduled rule ran or if a rule matched a specific event. However, you can’t see this metric in CloudWatch until a rule is triggered.
So, instead of forwarding the Datadog events from EventBridge to a CloudWatch Log Group, we can, instead, create a target-less rule and use the TriggeredRule metric created by EventBridge to setup our CloudWatch Alarm.
However, you can’t create that target-less rule using the EventBridge console.
Instead, you must use the AWS CLI as follows:
aws events put-rule --name DatadogErrorRule --event-pattern "{\"source\":[{\"prefix\":\"aws.partner/datadog.com\"}],\"detail-type\":[\"Datadog Alert Notification\"],\"detail\":{\"alert_type\":[\"error\"]}}" --event-bus-name aws.partner/datadog.com/DataDogEB
{
    "RuleArn": "arn:aws:events:us-east-1:696105942657:rule/aws.partner/datadog.com/DataDogEB/Test2"
}
Once you have that EventBridge rule in place, you can review CloudWatch metrics for the EventBridge rule by doing the following:
Open the CloudWatch console.
Select All Metrics.
Select the AWS/Events namespace.
Select the TriggerRules metrics for the rule in question.

You can use that metric to create a CloudWatch Alarm similarly to how we created the CloudWatch Alarm in the previous section, which you can then use as an AWS FIS stop condition.

Cross-account EventBridge delivery
A common architectural approach adopted by customers is to isolate application components or services by using separate AWS accounts. This “account-per-service” strategy limits the blast radius by providing a logical and physical separation of resources.
Luckily, EventBridge supports cross-account scenarios as follows:

To enable events flowing from one account to another, you need to create a rule on the event bus that routes events to an event bus in another account. This means you need to create a rule in the AWS Account 1 with an EventBridge bus as a target in the AWS Account 2. You also need the target bus to have a policy that allows the source account to send events to it. This is done with a resource policy associated with the event buses.
For more details on setting up these resource policies for cross-account EventBridge delivery, check this blog post.
Cost consideration
Relevant EventBridge pricing (us-east-1):
SaaS events — $1.00/million events published.
Cross-account events — $1.00/million events send.
Relevant Cloudwatch pricing (us-east-1):
First 10,000 metrics — $0.30 metric/month.
Alarm — $0.10 per alarm metric.
Logs — $0.50 per GB
Relevant Fault Injection Simulator pricing (us-east-1):
$0.10 per action-minute
That’s all, folks. I hope this tutorial will help you move forward with your chaos engineering journey. Don’t hesitate to give me feedback, share your opinion, or clap your hands. Thank you!
Adrian
—
Subscribe to my stories here.
Join Medium for $5 — Access all of Medium + support me & others!