

Planning your first experiment


In Part 1 of this series, I introduced chaos engineering and explained how it helps uncover and fix unknowns in your system before they become outages in production; and also how it fosters positive cultural change inside organizations.
While I promised at the end of Part 1 to talk about “the tools and techniques used to inject failures into systems” — I had to follow the “logical” way my mind works.
So, in this post, I’ll instead answer the most common question asked by people who want to start practicing chaos engineering:
“What do you break first?”
Fair question!! And certainly not a question that this panda seems to have the answer to.

Short answer: Target critical services in your request path.
Long, but wiser answer: There are three areas that you need to invest in, in order to figure out the smartest way to start your chaos engineering experiments: (1) look at your outage history and find patterns; (2) figure out your critical dependencies; (3) look out for the overconfidence effect.
Interestingly enough, this chapter could easily be titled: Journey to Self-Discovery and Enlightenment. It’s also the part where you start playing with fun tools.
1 —The answer lies in the past
If you remember Part 1, I outlined the Correction-of-Errors (COE), our process in which we deep-dive on failures — failures in technology, process, or in the organization — to understand the reason(s) why they happened and prevent them from happening in the future. Well, this is where you should start.
“You have to know the past to understand the present.” ― Carl Sagan
Look at the history of your outages, tag your COEs or postmortems, and categorize them. Find the common patterns that are often causing failures, and for each of the COEs, ask yourself the following question:
“Could this have been understood, and hence prevented, with a failure injection?”
I remember an outage early in my career that would have been easily prevented had we conducted some simple chaos experiments:
In normal conditions, backend instances are answering a health check from the Elastic Load Balancer (ELB). The ELB uses that health check to route requests to the healthy instances. When the ELB determines that an instance is unhealthy, it stops routing requests to that instance. One day, following a successful marketing campaign and heavier-than-usual traffic conditions, backend instances started to respond to health checks slower than usual. That health check was a deep health check, meaning that it probed for dependency failures.
Still, everything remained OK.
Then, while in stress condition, one of the instances started a routine, non-critical, ETL cron job. The combination of the heavy traffic and the cronjob saw CPU utilization climb by nearly 100%. The CPU overload made the response to the ELB health check even slower — so slow, in fact, that the ELB failed it enough times to think that the instance had become unhealthy. As expected, the ELB stopped routing traffic to it, which in turn sent even more traffic to the rest of the instances in the group.
Suddenly, all the remaining instances started to fail the health check.
Since launching a new instance required downloading and installing packages, it took a lot longer to start new instances than it took the ELB to take them — one-by-one — out of the auto-scaling group. Sure enough, the tipping point was reached and through service dependency failure, the entire application went down.
What we learned that day was:
Don’t install software when launching a new instance — favor immutable and Golden AMI principals.
In difficult situations, prioritize answering the ELB’s health-check — the last thing you want to do is create more trouble for the rest of the fleet.
Local caching of the health-check — even for few seconds — will help.
In a difficult situation, don’t perform cron jobs or other non-critical tasks — keep your resource for critical tasks.
Use smaller instances when auto-scaling. An auto-scaling group with 10 smaller instances is better than one with 4 big instances; if one fails, the surge of traffic is 10% spread over 9 instances vs 25% spread over 3.
So, “Could this have been understood, and hence prevented, with a failure injection?”
The answer is YES. How? In a few ways.
First, by simulating high CPU load in the instances with tools like stress-ng or cpuburn.
❯ stress-ng --matrix 1 -t 60s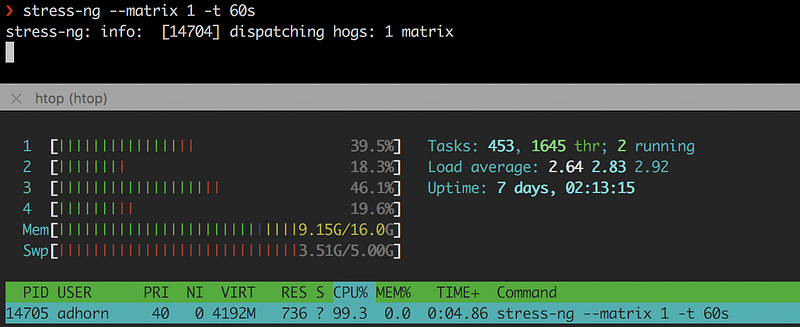
Second, by overloading the instance with tools like wrk .
❯ wrk -t12 -c400 -d20s http://127.0.0.1/api/health
Both are relatively simple experiments, and both could have yield a lot of the above learning, without the stress of the outage.
However, don’t stop there. Try to reproduce the outage in a test environment and verify your answer to the question : “Could this have been understood, and hence prevented, with a failure injection?”
This is a mini-chaos experiment inside a chaos experiment to verify your assumptions, but starting from the outage.

So, look at your history, analyze your COEs, tag them and classify them by order of blast radius — or more precisely, by the number of customer affected — then look at the patterns. Ask yourself: “Could this have been understood, and hence prevented, with a failure injection?” Verify your answer.
Then, tackle the most common patterns that also have the largest blast radius.
2 — Map your dependencies
Take a moment to think about your application. Do you have a clear map of its dependencies? Do you know what impact they will have in the event of failure?
If you’re not familiar with your application code or if it grows too large, it can be difficult to know exactly what the code does and what its dependencies are. Understanding those dependencies and how they could be impacting your application and users is critical to understanding where to start with chaos engineering — the largest blast radius being the starting point.
Identifying and documenting these dependencies is called dependency mapping and it’s typically conducted for large application code-bases using tools such as code profiling and instrumentation. It’s also possible to conduct dependency mapping by monitoring network traffic.
Further complicating things, not all dependencies are the same. Some are critical and some are non-critical — theoretically at least, since outages are often created by a dependency that was believed to be non-critical.
Critical dependencies imply that your service cannot operate without them. Non-critical dependencies “should” have no impact on your service if they were to fail. Getting a handle on dependencies requires a clear understanding of the APIs used by your application, and it can be a lot harder than it seems, at least for larger applications.
Start by enumerating your APIs. Identify the most expensive and critical ones. Pull the dependencies from the code repository, look at connection logs, then pull the documentation (if it exists — hopefully it does or you have a bigger issue at hands). Use profiling or tracing tools and filter out external calls.
Use programs like netstat, a command line utility that lists all the network (socket) connections on a system. For example, to list out all the current connections:
❯ netstat -a | more
On AWS you can use VPC flow logs, a feature that enables you to capture information about the IP traffic going to and from network interfaces in your VPC. Flow logs can help you with a number of other tasks — for example, troubleshooting why specific traffic is not reaching an instance.
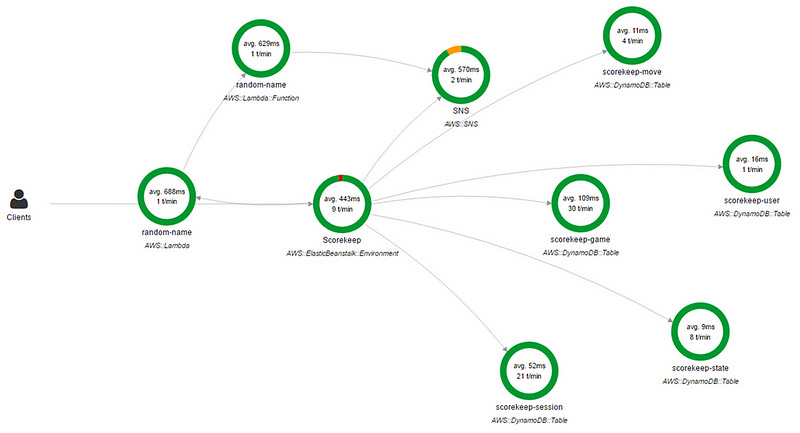
You can also use AWS X-Ray. X-Ray provides an end-to-end view of requests as they travel through your application and shows a map of the application’s underlying components. Pretty handy when you need to identify dependencies.
Mapping network dependencies is only a partial solution. Yes, it tells you which applications talk to which applications, but there are other dependencies.
Many applications use DNS to connect to their dependencies, while others may use service discovery or even hard-coded IP addresses in configuration files ( /etc/hosts).
For example, you can create a DNS blackhole to see what breaks using iptables with the following command:
❯ iptables -I OUTPUT -p udp --dport 53 -j REJECT -m comment --comment "Reject DNS"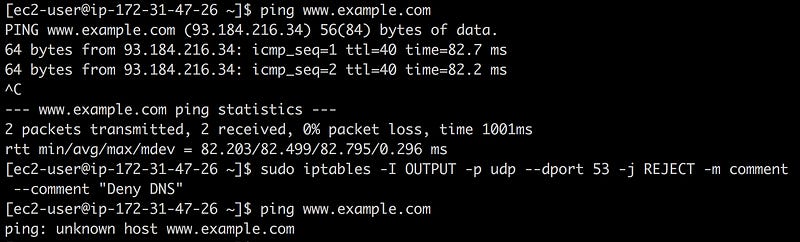
If you find IP addresses in the /etc/hosts or other configuration files that you don’t know about (yes, unfortunately that happens), iptables can be handy. For example, if you find the IP address 8.8.8.8 and you don’t know it’s Google public DNS server, using iptables, you can remove access, in-and-out of that address, using the following command:
❯ iptables -A INPUT -s 8.8.8.8 -j DROP -m comment --comment "Reject from 8.8.8.8"
❯ iptables -A OUTPUT -d 8.8.8.8 -j DROP -m comment --comment "Reject to 8.8.8.8"
The first rule drops any packets coming into your system which originated from Google’s public DNS — the ping works but the packets are not coming back. The second rule will drop any packets originating from your system destined for Google’s public DNS — ping operation is not permitted.
Note: in this particular example, using the command ❯ whois 8.8.8.8 would have been smarter — but it was just an example :)
You can go down the rabbit hole even further if you wish, since anything that uses TCP or UDP is, in fact, dependent on IP. In most cases, IP is dependent on ARP. Then you have firewalls …

More radically, turn off each machine one-by-one and see what breaks… become the chaos monkey ;) Of course, many production systems don’t allow for this type of brute force attack, but at least you can see what you can do in the test environment.
Mapping dependencies is often a long journey. I recently spoke to a customer who spent nearly two years building a tool that semi-automatically builds dependency maps across hundreds of micro-services and teams.
The result, however, is extremely interesting and helpful as you’ll learn a lot about your system, its dependencies, and operations Again, be patient — it’s the journey that matters the most.
3 — Watch out for complacency
“What a Man wishes, he will also believe” — Demosthenes
Have you ever heard of the overconfidence effect?
According to Wikipedia, the overconfidence effect is a “bias in which a person’s subjective confidence in his or her judgements is reliably greater than the objective accuracy of those judgements, especially when confidence is relatively high.”

I’ve found this bias to be a good indicator of where to start with chaos engineering.
Beware of the overconfident operator:
Charlie: “It hasn’t failed in five years, we’re safe.”
Failure: “ Hold my beer …”
The bias from overconfidence is tricky and even dangerous because of the different factors that influence it. This is particularly true when team members are deeply invested in a specific technology or when they’ve already spent a lot of time “fixing” things.
Wrapping up.
Figuring out where and how to start with chaos engineering always yields a lot more learning than anticipated, and teams that start breaking things too fast miss out on the bigger and more interesting picture of (chaos) engineering — a creative application of scientific methods and empirical evidence for the design, development, operation, maintenance and improvement of (software) systems.
That’s all for Part 2, folks. Please don’t hesitate to share your feedback and opinions, or simply clap your hands. In the next post, I’ll __really__ review tools and techniques to inject failures into systems. Until then, stay banana!
Adrian
—
Subscribe to my stories here.
Join Medium for $5 — Access all of Medium + support me & others!